
Business Intelligence In Financial Institutes

Photo by Stephen Dawson on Unsplash
Business Intelligence (BI) as such is already known since the 1960s. However, back then, a choice between different BI tools was practically non-existent and its usage only possible for a few IT-specialists. Consequently, also the methods of business intelligence were hardly applicable to everyday management decisions.
Since then, a lot has changed: Managers of every level refer to the one or the other BI method to master the challenges of their daily work life and also the business departments employ BI techniques to get most out of their data. However, in most cases, standard office software in combination with database queries work as universal remedy for BI questions and only few make use of the plethora of powerful self-service BI tools (SSBI tools) available on the market.
Thus, this article elaborates on the potential of BI in general and SSBI tools in particular. Further, we summarize pros and cons of the different methods and compare these to the well-known and very individual MS Excel & Access dashboard solutions.
What Is Business Intelligence?
The Gartner IT Glossary defines “Business Intelligence” as “an umbrella term that includes the applications, infrastructure and tools, and best practices that enable access to and analysis of information to improve and optimize decisions and performance [1]. It thus summarizes any means of data discovery, analysis and visualization that are needed to support management decisions to optimize business processes, the definition of strategic goals and data extrapolation of any kind.
With the introduction of artificial intelligence (AI) components into daily business processes, in particular the extrapolation aspect of BI analyses became increasingly important over the years: Most of the SSBI tools profit from improved forecasting features due to machine learning algorithms and high-quality statistical models [2].
What Is The Difference Between BI And
Self-Service BI?
BI tools or the use of BI tools can be split into a technical and a “business” part. The technical part of the BI analysis is usually carried out by the IT department, following the definitions and requirements of the business department. The business department is provided with the ordered report, interprets and further analyzes the charts and data, and, possibly, also refines the former requirements and thus starts the process anew.
SSBI tools in contrast are designed as do-it-yourself tools and are intended to be fully operated in the business departments. Thus, the additional loop of giving requirement specifications to the IT department, getting a report, reworking the requirements and getting another report – is eliminated to render the entire process of the BI analysis as lean as possible. To achieve this goal, the full potential of SSBI software must be accessible without deeper knowledge of statistical methods, programming hacks etc. without cutting the BI-functionality of the tools. Different providers of SSBI tools found different ways to fulfill these requirements.
Thus, the central question is how business intelligence is or should be realized in a particular business environment since there are as many tools to choose from as there are aspects to analyze.
Traditional Approaches: Pros & Cons Of BI With Access, Excel & Co.
One very straightforward solution to realize business intelligence certainly is the employment of the resources at hand. MS Office software therefor often suggests itself for the first steps of a BI analysis and dashboard compilation. However, with a closer look, there are also several disadvantages of this solution and it might be good investment of time to consider a dedicated SSBI tool instead.
In the following, we firstly discuss several of the pro and con arguments of the “traditional” and usually self-built MS Office BI-solutions.
More on BI and process optimization


PRO MS Office
Con MS Office
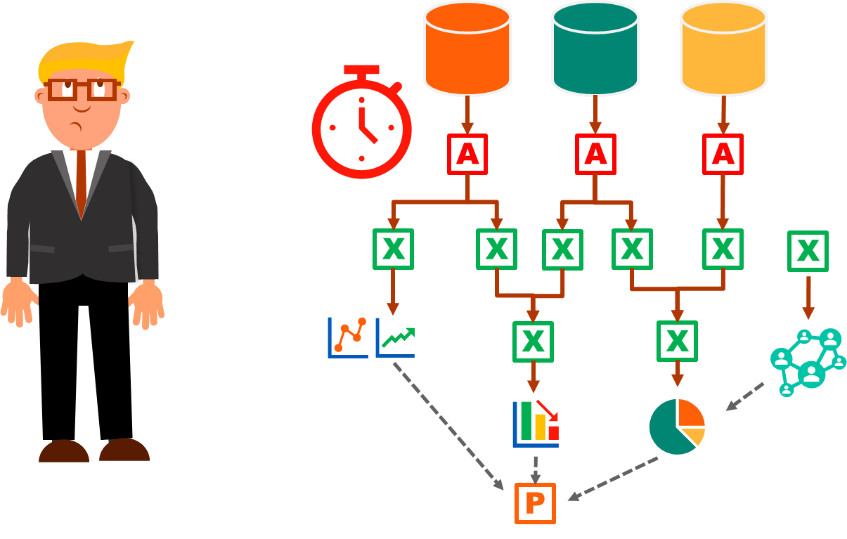
EXAMPLE. Suppose an analysis requires the integration of several data sources, a set of diverse transformations and multiple steps of analysis with distinct graphical representations. Completing this task with MS Office programs results in a highly complex and cumbersome endeavor to transfer the data from the original data bases or data warehouses to Access, Excel and finally maybe Power Point to achieve the desired BI-Analysis in form of a dashboard.
The following aspects summarize the downsides of this process:
- Each step of the analysis must be completed and maintained individually (file-wise).
- All visualization elements must be customized individually per instance.
- Modifications of the initial analysis are often hard to implement soundly through all instances of the analysis.
In Summary, the advantages of individually crafted MS Office BI solutions are quickly outnumbered by the mentioned disadvantages. This is particularly true if the data set to be analyzed is of considerable size, if the analysis is supposed to be shared among and modified by several team members or if it seems likely that a “quick-and-dirty” report will be in use and evolving for a longer time. The more sensitive the data, the more important are highly automized, transparent and stable data transformations that can be easily documented and trouble-shooted, if necessary.
Thus, this article continues with elaborating on SSBI tools representing a serious alternative to self-built MS Office BI solutions.
State Of The Art: Why The Investment In Self-Service BI Tools Pays Off

SSBI tools provide non-technical business users with means to collect, analyze, visualize and share data. Offering a rather intuitive handling, enhanced data analysis functionality and modular visual elements, end users can easily compile the needed dashboard or report or investigate their data without considerable effort. In more detail, SSBI tools offer the following advantages:
All-in-one solutions. SSBI Tools encompass all components to allow for a thorough and complete data analysis, visualization and a (refining) real-time investigation in form of a report or a dashboard.
Software Performance. Most SSBI Tools allow for the real-time analysis and processing of large data sets, still maintaining minimum response times due to in-memory data handling [3]. Thus, technical prerequisites allow for the best possible reaction rate of a report’s recipient to the status quo.
Less potential for errors. Since the distinct sub-steps are all seamlessly integrated and carried out in one software environment, the potential for unsystematic, manual errors is minimized.
Intuitive operation. SSBI tools are designed to be fully operated by the end user, meaning non-IT specialists of the business departments. All user interfaces and menus are set up to be handled predominantly intuitively, such that the tool can be operated without extensive trainings and seminars. For instance, the tools usually provide drag & drop or on-click functionalities instead of command line statements and scripting. This operation design also significantly speeds up the compilation of reports and dashboards.
Process Efficiency. Due to the all-in-one design and transparent analysis processes, all steps from collecting data to the final formatting of charts can be realized with maximum efficiency. For example, the waste of time due to the copying of data between worksheets or switching programs between the analysis and visualization of data is avoided. Further, visual elements are linked with each other and to the data source. Thus, updates are immediately included in already compiled dashboards and reports. This feature is particularly useful and time-saving when compiling ad-hoc reports from pre-built report templates.
Reproducibility & Traceability. The reports can be reproduced on the same data at any time or it can be easily modified due to changing requirements. All steps are easily traceable due to clear & transparent design.
In the light of these advantages, we look into the detailed steps of building a report in the next section.
Settling Down To Work: Three Steps To Build A Report

Figure 1: Three steps to build a report with SSBI Tools. Source: Finbridge GmbH & Co. KG
Independent from the BI Tool in use, the main steps leading to a new report or dashboard are always similar, cf. Figure 1 :
Step 1 The Data Model & Basic Analysis

The first step in developing a BI report is the collection of relevant data. Identifying the necessary data sources, extracting and importing the data set and thus creating a data model for later analysis forms the basis for the next steps.
Here, an important feature of BI Tools is evident: Having a variety of predefined interfaces onboard, the connection to numerous different data sources such as files, flat files, databases or online services can be established without further ado. As soon as the data is available in the BI Tool, the data model can immediately be refined and configured to fit the user’s needs with the help of data filters, transformations and the removal of columns. The main goal of this step is to keep the data model as lean and clear as possible and thus to reduce unneeded additional data and unnecessary complexity for the following steps.
Step 2: Visualization On dashboards & Data Discovery

To build a dashboard, deliver and present a concise and comprehensive review on your data, the next step is a thorough analysis. Further transformations and for example the merging of different data sets of the data model are therefore in place before the presentation of data can be tackled.
Next, it is essential to choose the proper form of visualization that should be applied and to connect the charts with the data model. SSBI-Tools offer a multitude of predefined graphics and charts that can be individually adapted. Since data and graphical representations, and -depending on the design- also the charts amongst each other are linked, one particular modification only needs to be performed once and is then handed down in real-time.
It is important to keep in mind that the charts themselves do not have to represent the final level of analysis: Equipped with additional filters and options, each chart still contains a bunch of information that the final user can easily access by pushing a small number of buttons. In this sense, the goal of the pre-analysis and dashboard compilation is to boil down the flood of data to relevant aspects and to make these aspects better digestible by visualization. By applying filters and options to the compiled charts, key parameters and conclusions can be deduced immediately.
For example: A report per business department should be compiled. It should contain, amongst others, information on the present interest portfolio per product. Instead of creating the chart separately for the departments, one chart with all data, filters for the product code, interest components over time and an option to choose the department can be designed. Depending on which option is chosen, the chart can be employed in several reports.
However, besides the targeted characteristics, the data might also contain hidden structures and aspects that are not obvious in the standard analysis approach. “Data discovery” is therefore a very important part of a thorough analysis, looking for yet unknown patterns and correlations. To identify these and allow for forecasts and trend analysis, some SSBI tools offer supporting “Advanced Analytics” functions such as machine learning (or more generally: AI) algorithms and/or the application of elaborate statistical methods.
Finally, it has to be emphasized that all analysis or data discovery activities of data sets can be performed by various team members, collaborating in one SSBI-project. Most SSBI tools offer distinct sharing functionalities/modes of their software for this purpose.
Step 3: Presenting, Scheduling & Sharing Of Reports

Once the core analysis and data discovery is completed, a set of charts and tables is compiled and ready to be published in form of a report or dashboard. SSBI Tools usually offer several channels for sharing the results with others.
First of all, there is the possibility to directly send the final report to certain recipients, e.g. via email, whereas a variety of formats is available to choose from. However, some tools also offer a common (server or cloud) platform that allow other users with according rights, to view, interact with or edit a published report. In some cases, a minute model of user rights can be established and access control is even possible for individual contents within a report.
Besides the question of whom a report is for, the question of when it should be published is essential. Most SSBI tools offer scheduling functionalities to facilitate an on time sharing of reports. In case of regular reports, an automatic update of all data sources can be included before the report is distributed to the designated recipients.
What are SSBI Tools used for, and by whom?
SSBI Tools can, of course, be applied in manifold ways. In principle, anyone who has some data to be rearranged, analyzed or reported can benefit from the intuitive design and the versatile functionality of SSBI Tools. There is neither the need for a profound mathematic-analytical background nor for extensive IT-Training sessions in order to gain in-depth knowledge from the data to be examined. Thus, no matter in which role, any team member is enabled to learn from their data and identify formerly hidden aspects.
In the following, we collected some examples of how BI Tools could be employed in the different bank departments, understood that these are not exhaustive.

Figure 2: Examples for applications of SSBI tools in different business departments of financial institutes. Source: Finbridge GmbH & Co. KG.
For a more specific insight into how these examples can be brought to life, read our forthcoming proof of concept that illustrates the compilation of a credit loss allowance dashboard with the help of Microsoft Power BI.
Quellen und Anmerkungen
[1] https://www.gartner.com/it-glossary/business-intelligence-bi/ ,
Downloaded on August, 27 2019.
[2] For example :
QLik & ML: https://www.qlik.com/de-de/bi/augmented-intelligence-and-analytics, Downloaded on August, 27 2019.
Power BI & ML : https://powerbi.microsoft.com/de-de/blog/tag/machine-learning/, Downloaded on August, 27 2019.
[3] For example: